
Best MLB Teams for NRFI Betting in 2026
Not all MLB teams are equal when it comes to NRFI betting. Some teams consistently score in the first inning; others routinely go scoreless. Tracking which teams have the lowest first-inning score rates — and how those rates shift throughout the season — is one of the most reliable edges in NRFI betting. Unlike most guides on this topic, the data below is pulled live from our model and updates daily.
2026 MLB Team NRFI Rankings
Live data · Updated daily · See all 30 teams →
Lowest Score Rate (Best for NRFI Bettors)
| Team | Record | Score Rate |
|---|---|---|
 Boston Red Sox | 122–39 | 24.2% |
 San Diego Padres | 121–39 | 24.4% |
 Toronto Blue Jays | 121–40 | 24.8% |
 Baltimore Orioles | 120–41 | 25.5% |
 Miami Marlins | 120–41 | 25.5% |
Min. 5 games · 161 avg games played this season
Highest Score Rate (Best for YRFI Bettors)
| Team | Record | Score Rate |
|---|---|---|
 Minnesota Twins | 106–55 | 34.2% |
 Los Angeles Angels | 106–54 | 33.8% |
 Houston Astros | 106–54 | 33.8% |
 Detroit Tigers | 107–54 | 33.5% |
 Kansas City Royals | 108–53 | 32.9% |
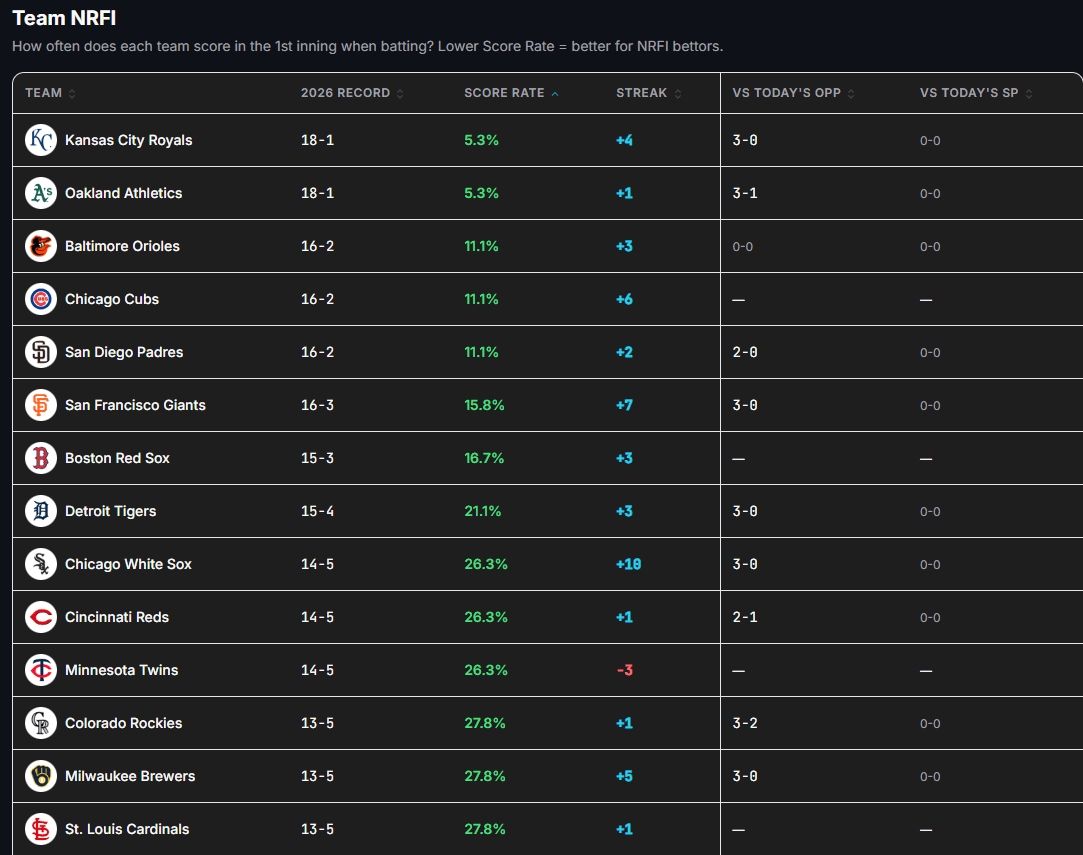
What Is First-Inning Score Rate?
Score Rate is the percentage of games in which a team scores at least one run in the first inning when they are batting. A team with a 20% score rate goes scoreless in the first inning 80% of the time — a strong NRFI target when they're facing a quality pitcher. A team with a 45% score rate scores in nearly half their games — a dangerous matchup.
Score rate is the cleanest single metric for evaluating a team's NRFI batting profile. It captures the combined effect of lineup construction, the quality of first-inning matchups they've faced, and their general offensive approach at the top of the order.
What Makes a Good NRFI Batting Team?
A Weak Top of the Order
The #1 and #2 hitters in the lineup drive first-inning run probability more than any other spots. A team whose leadoff man has a .310 OBP is far less dangerous in the first inning than one with a .390 OBP leadoff hitter. Teams that platoon or rotate their leadoff spot frequently tend to have more volatile first-inning scoring profiles — a fact worth tracking throughout the season.
Lineup Injuries and Call-ups
A team's NRFI profile can change overnight when a key top-of-order hitter hits the IL. If a team's most dangerous #1 or #2 hitter is replaced by a call-up, the effective score rate drops significantly — even if the season-to-date number hasn't caught up yet. Checking transaction news before betting is one of the highest-value habits an NRFI bettor can have.
Low-Contact Offense
Teams built around power (home runs, slugging) rather than contact and baserunning tend to have lower first-inning score rates. They need multiple things to go right in a single inning to score — whereas a contact-heavy lineup with stolen base threats at the top can score with two singles and a sac fly. High-K% lineups are generally better NRFI targets.
How to Use Team NRFI Stats in Your Picks
Team score rate is a supporting signal, not a standalone reason to bet. The best NRFI picks combine multiple favorable factors:
- Low score rate team batting against a strong pitcher with favorable handedness splits
- That pitcher is in a neutral or pitcher-friendly park
- The lineup is confirmed with no surprise changes at the top of the order
- The model's probability exceeds the sportsbook's implied probability (+EV)
A low-score-rate team facing a bad pitcher is not a NRFI bet. The pitcher is the primary driver. Use team score rate to confirm or strengthen a pick, not to originate one. Our full prediction model weighs all of these variables together through Monte Carlo simulation — the team score rate data is one of several inputs.
A Note on Sample Size Early in the Season
In April, most teams have played 10–15 games — a sample where variance is enormous. A team showing a 10% score rate through 10 games is probably benefiting from favorable matchups and some luck, not demonstrating a true skill difference. Treat early-season score rates as directional signals, not settled truths.
By June (50+ games), the numbers become meaningfully more stable. By the All-Star break, you're working with 80+ game samples that give a reliable picture of a team's true first-inning scoring profile. Our model blends 2026 season data with prior-season statistics using a shrinkage approach — which means early-season outliers are smoothed out rather than taken at face value.
See all 30 teams — updated daily
Full sortable table with 2026 records, score rates, streaks, and contextual stats vs. today's opponents and starting pitchers.
Related Guides
- How to Bet NRFI: Complete Strategy Guide for 2026— EV, Kelly, and finding +EV picks
- What Is NRFI in Baseball Betting?— The basics explained