
How to Bet NRFI: Complete Strategy Guide for 2026
Betting NRFI successfully comes down to one question: how likely is it that neither team scores in the first inning — and is that probability higher than what the sportsbook is pricing in? This guide covers everything you need to answer that question: the types of NRFI bets, how to read the odds, what actually drives first-inning probability, and how to size bets responsibly.
What Is an NRFI Bet?
NRFI stands for No Run First Inning. It's an MLB prop bet that no runs will be scored in the first inning of a game. Most sportsbooks offer two versions: a Team NRFI (betting one specific team doesn't score) and a Combined NRFI (betting neither team scores). For a deeper explanation of how the bet works, see our NRFI explainer guide.
Types of NRFI Bets
There are two main types you'll see at sportsbooks:
- Team NRFI — You're betting that one specific team (away or home) does not score in their half of the first inning. Because only one team needs to go scoreless, these bets are typically priced around -160 to -350 or higher depending on the pitching matchup.
- Combined NRFI — You're betting that neither team scores in the first inning. Both the top and bottom of the first must be scoreless. This is the more popular market — odds can range from around +115 to -185 or beyond on either end depending on the matchup.
Combined NRFI is where most serious bettors focus their attention. The implied probabilities are lower, which means there's more room to find edges when the model disagrees with the sportsbook.
How to Read NRFI Odds
NRFI odds are expressed in American format. Here's how to convert them to implied probability:
- Negative odds (e.g., -130): Implied probability = 130 ÷ (130 + 100) = 56.5%
- Positive odds (e.g., +110): Implied probability = 100 ÷ (110 + 100) = 47.6%
The sportsbook's implied probability always includes their margin (the vig). The combined implied probability of NRFI and YRFI will add up to more than 100% — the difference is the house's edge. A well-calibrated prediction model removes the vig and gives you a true probability to compare against.
The Four Factors That Drive NRFI Probability
First-inning run scoring isn't random. These four variables explain the majority of the variance:
1. Starting Pitcher Quality
This is the single most important factor. The starting pitcher faces the top of the order in the first inning when their stuff is freshest. The metric that matters most is xwOBA (expected weighted on-base average) — split by batter handedness. A pitcher with a .260 xwOBA against right-handed batters who faces a right-heavy lineup is a very strong NRFI candidate. ERA is a lagging indicator; xwOBA captures contact quality on every pitch.
Also worth tracking: pitchers who are slow starters. Some pitchers consistently allow more first-inning damage before settling in — their season xwOBA looks clean but their first-inning OBP-allowed is elevated. Our model accounts for this with first-inning splits where sufficient sample size exists.
2. The Batting Lineup
The leadoff hitter carries disproportionate weight. In a Monte Carlo simulation of 10,000 half-innings, the #1 spot in the order touches the plate first on every single simulation — their OBP directly sets the table for everything that follows. A team whose leadoff man is on the IL and replaced by a weak hitter is a notably better NRFI target than their season stats suggest.
The most useful team-level metric is first-inning score rate — the percentage of games where a team scores in the first inning when batting. You can track all 30 teams live on our Team NRFI stats page.
3. Park Factors
Not all ballparks are created equal. Coors Field (Colorado) inflates run scoring by roughly 11% — NRFI is a harder bet in Denver. Oracle Park (San Francisco) and Petco Park (San Diego) are pitcher-friendly venues that suppress scoring. Park factors apply to both teams equally and have a measurable effect on first-inning probability, especially for games on the margin.
4. The Matchup Stack
The best NRFI spots stack multiple favorable factors: an elite pitcher facing a low-score-rate batting order, in a neutral or pitcher-friendly park, with a confirmed lineup showing no dangerous surprise changes. When both teams fit this profile — a "dual NRFI" setup — combined NRFI probability can push above 60%, which creates clear value against typical sportsbook pricing.
Understanding Expected Value (+EV)
Expected value (+EV) is the core concept behind profitable sports betting. A bet is +EV when your estimated probability of winning is higher than the probability implied by the sportsbook odds.
Example
Our model calculates a 58% chance of NRFI for a given game. The sportsbook prices it at -125, which implies 55.6% probability. The gap is +2.4% in our favor — that's a +EV bet. Over enough of these opportunities, consistent +EV betting improves long-run results.
It's important to be clear: a +EV bet doesn't win every time. A 58% probability means the bet loses 42% of the time. The value comes from capturing the edge consistently over hundreds of bets, not from any single outcome. Our model tracks this with a live +EV record updated after every game.
Bet Sizing with Kelly Criterion
Finding a +EV bet is half the job. The other half is knowing how much to bet. Kelly Criterion is the mathematically optimal bet sizing formula — it maximizes long-run bankroll growth while managing the risk of ruin.
The Kelly formula is: f = (bp - q) / b, where:
- b = decimal odds minus 1
- p = your estimated win probability
- q = 1 − p (loss probability)
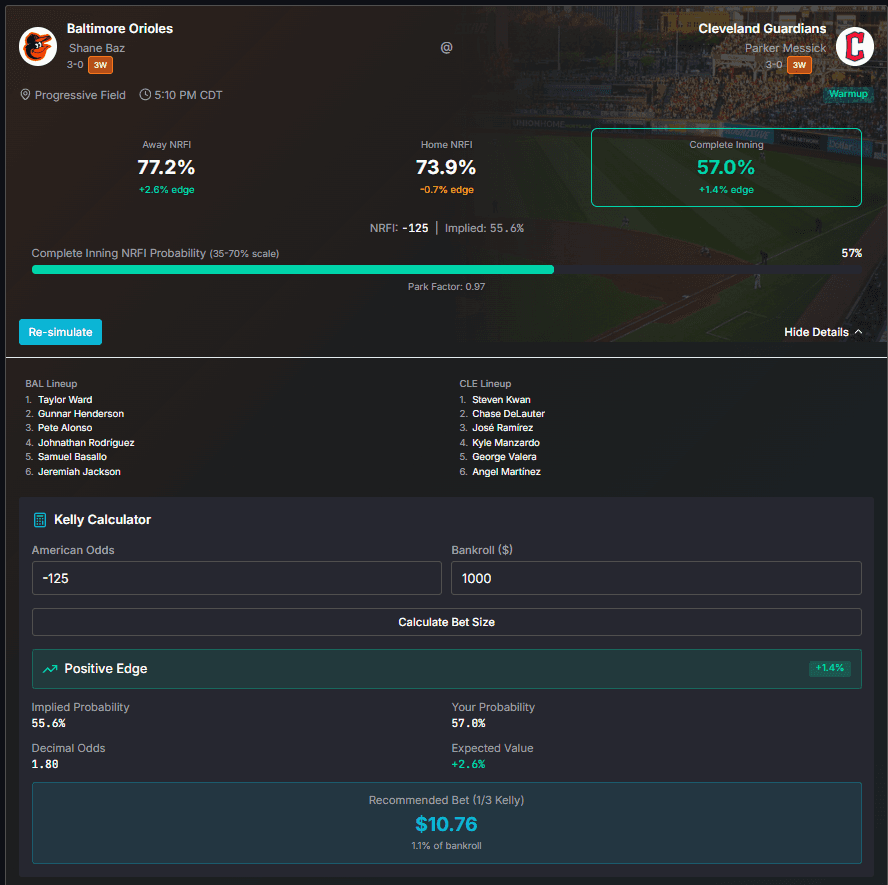
In practice, most bettors use a fractional Kelly — betting 25–50% of the full Kelly amount — to smooth out variance while still capturing most of the growth benefit. The NRFI Predictor calculates Kelly-optimal sizing for each game automatically when you enter your bankroll.
Using the NRFI Predictor Tool
Our model runs 10,000 Monte Carlo simulations per game, using:
- Pitcher xwOBA splits vs. left-handed and right-handed batters
- Batter wOBA splits vs. the pitcher's handedness
- Sprint speed data for baserunning advancement
- Confirmed lineups from the MLB Stats API
- Park factors for all 30 stadiums
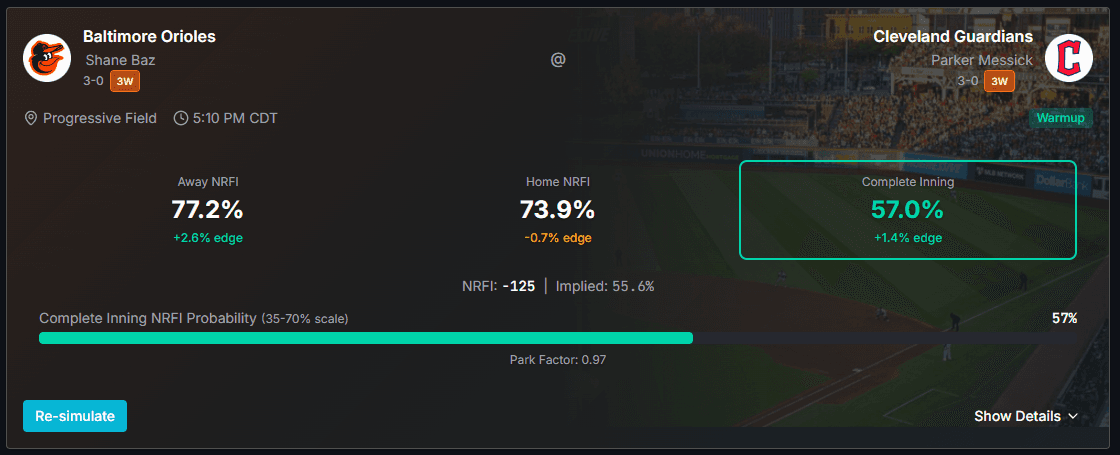
Each simulation produces a first-inning run total for both teams. Across 10,000 iterations, the percentage of games where both halves score zero runs is the model's NRFI probability. That probability is then compared against the live sportsbook odds to calculate edge and flag +EV bets.
What to look for when reviewing picks:
- Positive edge — model probability exceeds the sportsbook's implied probability
- Confirmed lineups — simulations are most accurate once the starting lineup is posted (typically 1–2 hours pre-game)
- Edge size — a 1–2% edge is marginal; 4%+ is strong. Sort by "Best EV First" to prioritize the highest-edge spots
Common NRFI Betting Mistakes
- Betting before lineups are confirmed. Lineup changes dramatically affect probability. A manager might scratch the cleanup hitter or shuffle the top of the order. Always wait for confirmed lineups before placing NRFI bets.
- Ignoring park factors. A +EV signal in Coors Field deserves extra skepticism. A marginal edge that looks neutral in a pitcher's park may disappear once park factor is applied correctly.
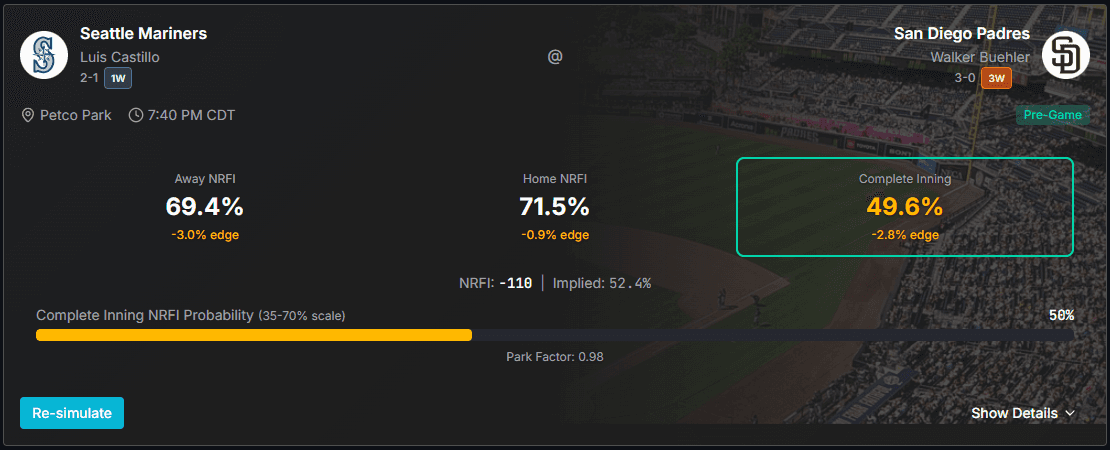
- Betting every game. The best bettors are selective. On a 15-game slate, there might only be 2–3 genuinely high-edge spots. Betting all 15 to "stay active" dilutes your edge and increases variance. When the model shows negative edge, that's a clear signal to sit it out.
- Chasing bad lines. If you miss the best available odds and the line moves against you, the edge may have disappeared. NRFI edges are small — line shopping and timing matter.
- Overreacting to recent results. NRFI hit three times in a row? That doesn't make the next game more likely to be an NRFI. Each game is independent. Let the model probability guide you, not recent streaks.
When to Bet YRFI Instead
YRFI (Yes Run First Inning) is the opposite side of the bet — at least one run scores in the first inning. When a game features a struggling pitcher, an explosive batting lineup at the top of the order, and a hitter-friendly park, the combined NRFI probability can fall below 40%. At that point, YRFI may be the +EV side. Our tool calculates both sides simultaneously so you can see which direction the edge points for any given game.
Put the strategy to work
Live NRFI probabilities, +EV picks, live odds, and Kelly sizing — all in one place. Simulations update every 10 minutes. Free, always.
Open the NRFI Predictor →Related Guides
- What Is NRFI in Baseball Betting?— The basics explained
- Best MLB Teams for NRFI Betting in 2026— Live 2026 score rates for all 30 teams